Image Details
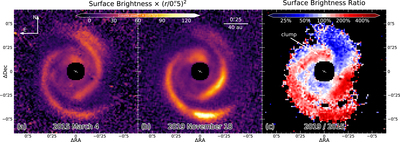
Caption: Figure 1.
VLT/SPHERE observations of MWC 758 spiral arms; (a) and (b) are the 2015 and 2019 scaled surface brightness Stokes ﹩{{ \mathcal Q }}_{\phi }﹩ images; (c) is the surface brightness ratio from dividing (b) by (a). In 2019, most of the southern region is more than twice the corresponding brightness of 2015; the northern region is less than half except for a brightened clump. The 184 mas diameter coronagraph used in 2019 blocks light in the central circular regions.
(The data used to create this figure are available.)
Other Images in This Article
Copyright and Terms & Conditions
© 2020. The American Astronomical Society. All rights reserved.
Copyright ©
2026 Astronomy Image Explorer. All Rights Reserved.