Image Details
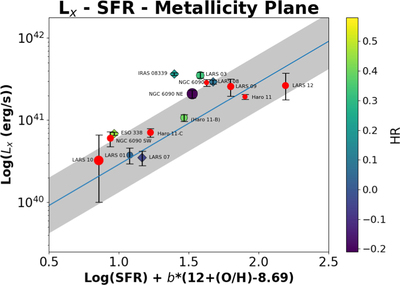
Caption: Figure 3.
LX–SFR–metallicity relation for star-forming galaxies, showing our sample and the relation from Brorby et al. (2016; blue line). Their observed 0.34 dex dispersion in the relation is shown by the gray band. Hardness ratio is indicated with the shown color scale; red points indicate objects without enough counts for a reliable HR estimate. Circles show Chandra ACIS observations, with point size scaled to source FWHM; diamonds indicate XMM data, which cannot resolve point sources in our sample. Haro 11-B is not a significant LAE, but is included for completeness. Data for Haro 11 and NGC 6090 are shown for individual subregions, as well as for total integrated values.
Other Images in This Article
Copyright and Terms & Conditions
© 2020. The American Astronomical Society. All rights reserved.