Image Details
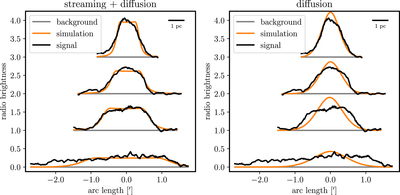
Caption: Figure 5.
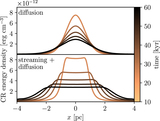
Comparison between the observed radio emission from the radio harp G359.47+0.12 (extracted from Heywood et al. 2019) and the simulated profiles. The simulated profiles are displayed at times 16, 26, 37, and 72 kyr (top to bottom) after CR injection. The filaments each have an offset of 1 in the y-direction. We convert physical distances in the simulation to angular sizes assuming a distance of 8.2 kpc to the CMZ. The streaming+diffusion model matches the MeerKAT radio data significantly better than the diffusion model.
Other Images in This Article
Copyright and Terms & Conditions
© 2020. The American Astronomical Society. All rights reserved.
Copyright ©
2026 Astronomy Image Explorer. All Rights Reserved.