Image Details
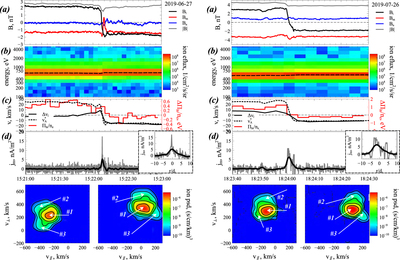
Caption: Figure 2.
Two discontinuities captured by ARTEMIS P2: (a) magnetic field in local coordinates, (b) ion spectrum and mean energy (black dashed line), (c) variations of vl, ﹩{v}_{{\rm{A}}}^{* }={v}_{{\rm{A}}}\sqrt{1-{{\rm{\Lambda }}}_{e}}﹩, and a nondiagonal ion pressure component Πln, (d) current density (top panels) the inserted panels show current density spatial distributions; the coordinate is normalized to the proton inertial length, di), (bottom panels) two cross sections of ion distribution before and after discontinuity crossings (see the text for details).
Other Images in This Article
Copyright and Terms & Conditions
© 2020. The American Astronomical Society. All rights reserved.
Copyright ©
2024 Astronomy Image Explorer. All Rights Reserved.