Image Details
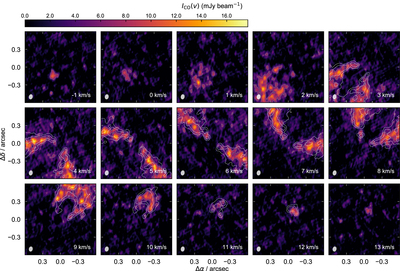
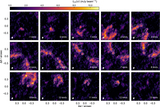
Caption: Figure 4.
Same as Figure 3, but for 13CO emission. The white dashed contours show the corresponding 12CO emission at 10 and 16 times the 12CO maps rms, while the gray solid contour shows 13CO at 3 times the rms level. The 7 km s−1 channel most clearly shows that 13CO do not exhibit the same obvious wiggle as in 12CO.
Other Images in This Article
Copyright and Terms & Conditions
© 2020. The American Astronomical Society. All rights reserved.
Copyright ©
2026 Astronomy Image Explorer. All Rights Reserved.