Image Details
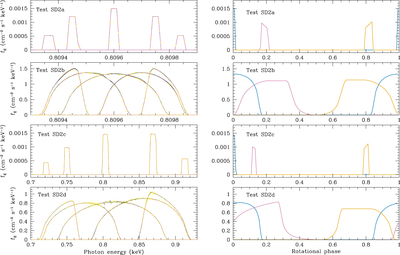
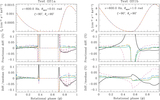
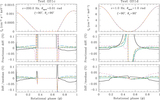
Caption: Figure 8.
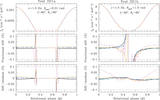
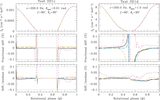
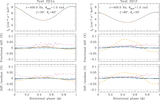
Left: results of the emission line tests SD2a–SD2d (from top to bottom, respectively) for five representative spin phases (ϕ = 0.25, 0.125, 0, 0.75, and 0.875, in order of increasing photon energy of the observed line) for the CU (black), IM (yellow), GSFC-M (orange), GSFC-S (blue), and AB (purple) codes. The spikiness evident in the spectra at some phases for the CU and IM codes is produced due to inexact interpolation of the line profiles. This interpolation problem is not an issue for realistic smooth spectra. Right: for test SD2a and SD2b the monochromatic pulse profiles at energies 0.8094 keV (produced by the AB code and shown in purple at ϕ ≈ 0.2), 0.8096 keV (produced by the GSFC-S and shown in blue at ϕ ≈ 0), and 0.8098 keV (produced by the GSFC-M and shown in orange at ϕ ≈ 0.8) are shown. For tests SD2c and SD2d, the monochromatic profiles at energies 0.75 keV (AB, purple), 0.8 keV (GSFC-S, blue), and 0.9 keV (GSFC-M, orange) are shown. Due to the narrow band nature of the emission lines, at a given photon energy in the observer rest frame the spot emission is only observed at some rotational phases.
Other Images in This Article
Show More
Copyright and Terms & Conditions
© 2019. The American Astronomical Society. All rights reserved.