Image Details
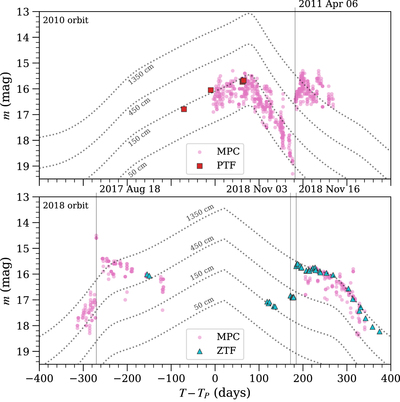
Caption: Figure 3.
Lightcurve of comet 240P/NEAT vs. perihelion time (T − TP) in 2010–2011 (top) and 2017–2018 (bottom). ZTF and PTF data are measured with 9.″5 radius apertures. Select photometry contributed to the MPC are also shown (see Section 2 for details). Model lightcurves are presented (dotted lines), based on the Afρ formalism using the indicated value at perihelion (9.″5 aperture, ﹩{r}_{{\rm{h}}}^{-6}﹩ scale factor). Approximate epochs of transition to increased activity levels are marked with vertical lines.
Other Images in This Article


Copyright and Terms & Conditions
© 2019. The American Astronomical Society. All rights reserved.
Copyright ©
2025 Astronomy Image Explorer. All Rights Reserved.