Image Details
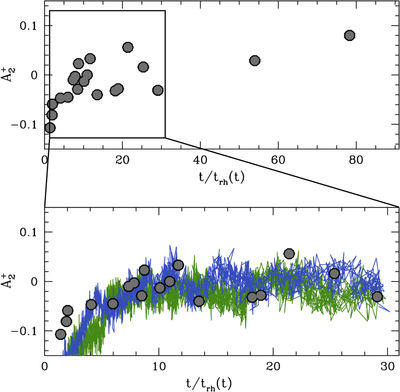
Caption: Figure 3.
Upper panel: distribution of ﹩{A}_{2}^{+}﹩ as a function of t/trh (Nh) for all the clusters in the sample. Bottom panel: zoom on the distribution of cluster with Nh < 30. Results from N-body models are overplotted to the observations. Blue and green curves represent models starting with an SP 5 and 10 times more centrally concentrated than FP, respectively.
Other Images in This Article
Copyright and Terms & Conditions
© 2019. The American Astronomical Society. All rights reserved.
Copyright ©
2025 Astronomy Image Explorer. All Rights Reserved.