Image Details
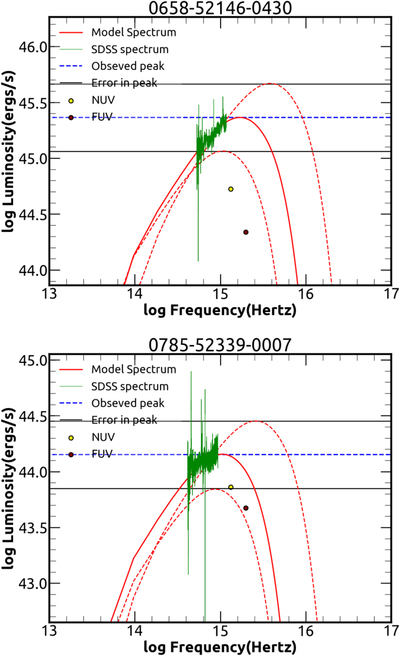
Caption: Figure 1.
AD fits to the observed spectrum for two sources: 0658-52146-0430 (top panel), and 0785-52339-0007 (bottom panel). Here green is the observed SDSS spectrum, and the red solid line is the calculated AD spectrum. The blue dashed line is the peak luminosity from the AD of the source derived from the Hβ luminosity. The solid black lines are the 1σ error in the peak luminosity that were used to estimate the error in ﹩{M}_{\mathrm{BH}}^{\mathrm{AD}}﹩. The filled circles are the GALEX measurements, which were not included in the fitting process.
Other Images in This Article
Copyright and Terms & Conditions
© 2019. The American Astronomical Society. All rights reserved.
Copyright ©
2025 Astronomy Image Explorer. All Rights Reserved.