Image Details
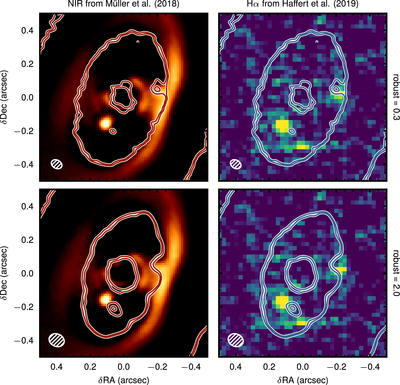
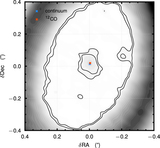
Caption: Figure 8.
VLT/SPHERE NIR image (left panels; Müller et al. 2018) and VLT/MUSE Hα image (right panels; Haffert et al. 2019). The white contours are drawn at 3 and 5 times the rms noise level of the 855 μm continuum emission, imaged with robust = 0.3 (top row) and robust = 2 (bottom row). The signal located in the southwest of PDS 70 b in the VLT/MUSE image is likely due to instrumental artifacts (Haffert et al. 2019).
Other Images in This Article
Copyright and Terms & Conditions
© 2019. The American Astronomical Society. All rights reserved.
Copyright ©
2026 Astronomy Image Explorer. All Rights Reserved.