Image Details
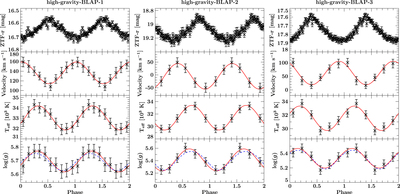
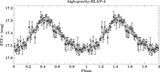
Caption: Figure 1.
Top row: binned and phase-folded ZTF light curve against pulsation phase. Second row from top: radial velocities against pulsation phase with a single harmonic fit (solid red curve). Third row from top: Teff against pulsation phase with a single harmonic fit (solid red curve), Bottom row: ﹩\mathrm{log}(g)﹩ against pulsation phase with the single harmonic fit (solid red curve) and the prediction from the fit to the radial velocities (dashed blue curve). The left panels show the results for high-gravity-BLAP-1, the middle panels show those for high-gravity-BLAP-2, and the right panels show those for high-gravity-BLAP-3. Two pulsation cycles are plotted for better visualization.
Other Images in This Article
Copyright and Terms & Conditions
© 2019. The American Astronomical Society. All rights reserved.