Image Details
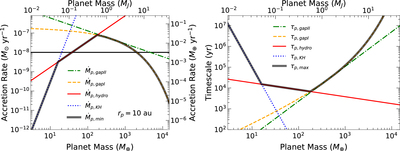
Caption: Figure 1.
Gas accretion rates and the resulting timescales as a function of planet mass in the left and right panels, respectively. The case where ﹩{r}_{p}=10\,\mathrm{au}﹩ is considered here. In the left panel, ﹩{\dot{M}}_{{\rm{d}}}﹩ is denoted by the horizontal, black line for reference. The minimum value of ﹩{\dot{M}}_{p}﹩ is denoted by the thick gray line. In the right panel, gas accretion timescales are computed by ﹩{\tau }_{p}={M}_{p}/{\dot{M}}_{p}﹩.
Other Images in This Article
Copyright and Terms & Conditions
© 2019. The American Astronomical Society. All rights reserved.
Copyright ©
2025 Astronomy Image Explorer. All Rights Reserved.