Image Details
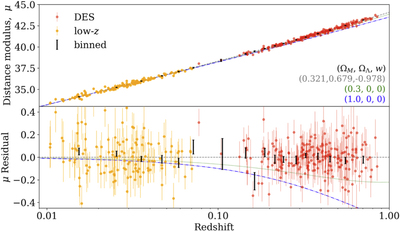
Caption: Figure 1.
Hubble diagram for the DES-SN3YR sample. Top: distance modulus (μ) from BBC fit (black bars, which are used for cosmology fits) and for each SN (red, orange circles). The dashed gray line shows our best-fit model, while the green and blue dotted lines show models with no dark energy and matter densities ﹩{{\rm{\Omega }}}_{{\rm{m}}}=0.3﹩ and 1.0 respectively. Bottom: residuals to the best-fit model; 1σ error bars show 68% confidence.
Other Images in This Article
Copyright and Terms & Conditions
© 2019. The American Astronomical Society. All rights reserved.
Copyright ©
2026 Astronomy Image Explorer. All Rights Reserved.