Image Details
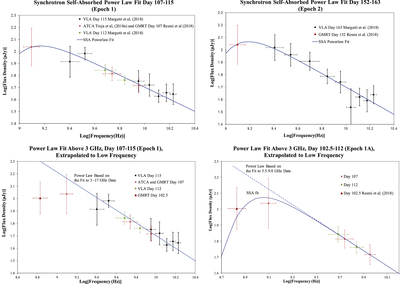
Caption: Figure 1.
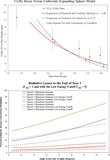
The top-left (top-right) frame is the radio data from epoch 1 (epoch 2). The SSA power-law fits of Equation (5) are the continuous curves (see Sections 2 and 3). The bottom frames extrapolate the power-law fit above 3 GHz to lower frequency revealing an excess at 675 MHz. The data in this figure is from Margutti et al. (2018), Troja et al (2018a), and Resmi et al (2018).
Other Images in This Article
Copyright and Terms & Conditions
© 2019. The American Astronomical Society. All rights reserved.
Copyright ©
2025 Astronomy Image Explorer. All Rights Reserved.