Image Details
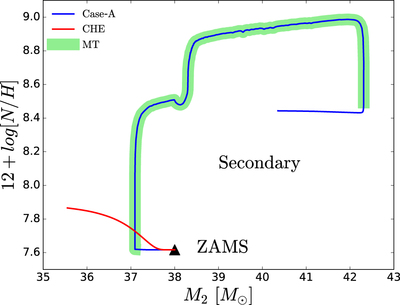
Caption: Figure 4.
Nitrogen surface abundance of secondary as a function of its mass for the Case-A MT (blue solid line) and the CHE (red solid line), respectively. The green shading corresponds to the MT phase, which is same as that shown in Figure 1. The black triangle represents the ZAMS.
Other Images in This Article

Copyright and Terms & Conditions
© 2019. The American Astronomical Society. All rights reserved.
Copyright ©
2026 Astronomy Image Explorer. All Rights Reserved.