Image Details
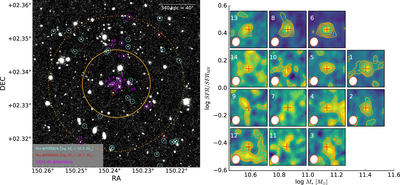
Caption: Figure 1.
Left panel: sky distributions of cluster members around the core of CLJ1001. The background image is the NB image from MOIRCS/Subaru at 2.3 μm. The cyan and red open circles denote low- and high-mass star-forming cluster members (Hα emitters) at z = 2.51 separated at M* = 1010.5 M⊙. The CO(1-0) detected members all have M* > 1010.5 M⊙, and are further indicated in magenta. The scale bar indicates the virial radius (R200c) of the cluster. The small and large orange circles denote the coverage of the JVLA observations, with the diameter corresponding to 1 and 2× FWHP of the primary beam at 32.878 GHz, respectively. Right panel: the velocity-integrated intensity map (moment-0) of CO J = 1–0 for the 14 galaxies detected by JVLA. The position of each panel is determined by their stellar mass and SFR (normalized by the SFR of MS galaxies at the same mass). Each panel is 12″ × 12″. Contour levels of CO(1-0) starts at ﹩\sqrt{2}\sigma ﹩ and increase as 2, ﹩2\sqrt{2}﹩, 4, 8, and 16σ. The red cross in each panel indicates the centroid of the stellar emission as determined from the HST/F160W (if available) or NB images. The derived integrated fluxes are presented in Table 1 .
Other Images in This Article
Copyright and Terms & Conditions
© 2018. The American Astronomical Society. All rights reserved.