Image Details
Caption: Figure 1.
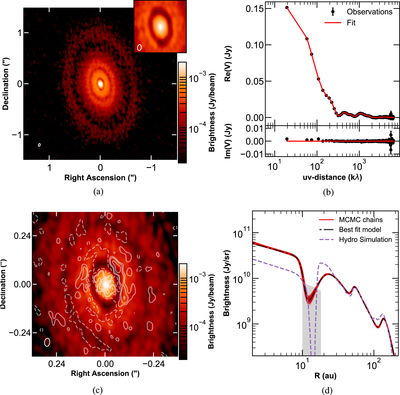
(a) Synthesized image of the CI Tau continuum observations (beam 50 × 30 mas FWHM, corresponding to 7 × 4 au). The rms noise level is σ = 13 μJy beam−1. The inset shows a 0.″35 wide zoom on the innermost gap imaged with a finer resolution (uniform weighting; 40 × 25 mas or 5 × 3.5 au, FWHM beam). (b) Observed visibilities compared with the best-fit model visibilities as a function of deprojected baseline. (c) Synthesized image (uniform weighting) with fit residuals as white contours drawn at −3σ, 3σ, 6σ, 12σ, etc. (d) A family of 5 × 10³ emissivity profiles drawn from the posterior (red). The black dotted−dashed line highlights the best-fit model. The gray shaded region indicates the range of gap depths that are still compatible with the observations. The dashed purple line shows the brightness profile obtained from the hydrodynamical simulation.
Other Images in This Article
Copyright and Terms & Conditions
© 2018. The American Astronomical Society. All rights reserved.