Image Details
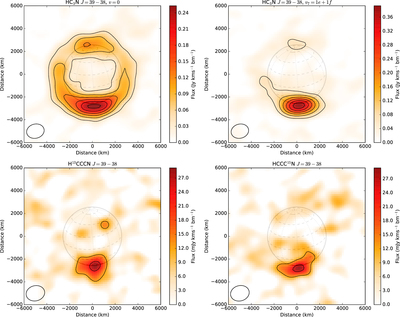
Caption: Figure 2.
Integrated emission maps of HC3N, including the ground-state (J = 39 − 38, v = 0) and vibrationally excited (J = 39 − 38, v7 = 1e and 1f) lines (top two panels), and the detected 13C and 15N isotopologues (bottom two panels). The contour interval is 5σ for the HC3N v = 0 and v7 = 1 lines, and 3σ for the isotopologues, where σ is the rms noise level. Wire frame shows Titan’s solid body, with 22.°5 increments in latitude and 30° in longitude. Ellipses (lower left) indicate the spatial resolution.
Other Images in This Article
Copyright and Terms & Conditions
© 2018. The American Astronomical Society. All rights reserved.
Copyright ©
2026 Astronomy Image Explorer. All Rights Reserved.