Image Details
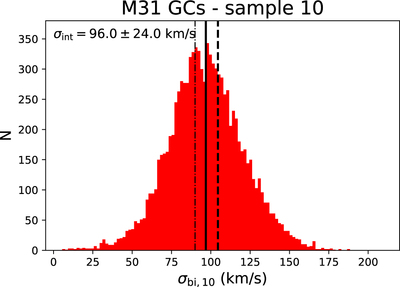
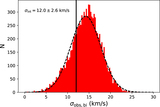
Caption: Figure 5.
Results from randomly sampling 10 GCs from M31's outer cluster population, and measuring their dispersion from the biweight-midvariance, as in vD18. The mean of this analysis is shown as the solid line, while the value from the full sample of 74 clusters is shown as the dashed line. The value of the velocity dispersion from M31 halo stars is shown as the dashed–dotted line.
Other Images in This Article
Copyright and Terms & Conditions
© 2018. The American Astronomical Society. All rights reserved.
Copyright ©
2025 Astronomy Image Explorer. All Rights Reserved.