Image Details
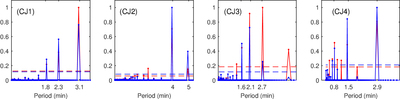
Caption: Figure 3.
Set of calculated FFT periodograms accordingly corresponding to cases shown in the bottom panels (CJ1), (CJ2), (CJ3), and (CJ4) of Figure 2. The coloring is the same as in Figure 2, and horizontal blue and red dashed lines represent 95% confidence levels for data set 2 and data set 1, respectively. The spectral powers are normalized on the maximum power pick shown in each panel.
Other Images in This Article
Copyright and Terms & Conditions
© 2018. The American Astronomical Society.
Copyright ©
2024 Astronomy Image Explorer. All Rights Reserved.