Image Details
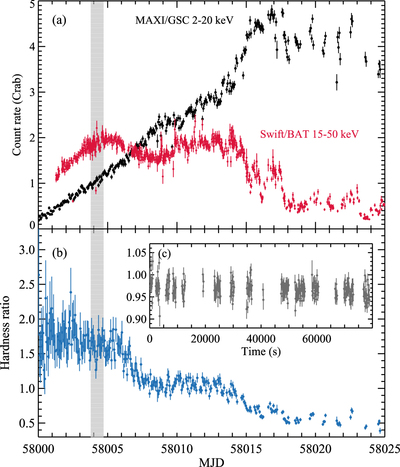
Caption: Figure 1.
(a) MAXI/GSC (black) and Swift/BAT (red) orbital light curves of MAXI J1535-571, scaled to the Crab count rates in the corresponding instrument bands (only BAT data points with S/N > 7 are included). The gray shaded area marks the duration of the NuSTAR observation. (b) MAXI hardness ratio calculated from count rates (4–20/2–4 keV). (c) NuSTAR hardness ratio in 100 s bins (count rates, 6–10/3–6 keV).
Other Images in This Article
Copyright and Terms & Conditions
© 2018. The American Astronomical Society. All rights reserved.
Copyright ©
2026 Astronomy Image Explorer. All Rights Reserved.