Image Details
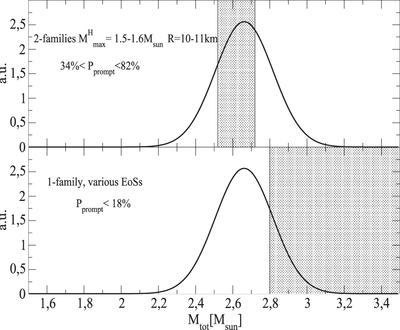
Caption: Figure 1.
Distribution of ﹩{M}_{\mathrm{tot}}={m}_{1}+{m}_{2}﹩ (solid line) estimated by using the analysis of Kiziltan et al. (2013). In the upper panel, the range of values of ﹩{M}_{\mathrm{threshold}}﹩ for ﹩{M}_{\max }^{H}=(1.5\mbox{--}1.6){M}_{\odot }﹩ are indicated by the gray area (the two-families scenario). In the lower panel, the range of values of ﹩{M}_{\mathrm{threshold}}﹩ in the one-family case is indicated. In this figure, the results of the analyses of Bauswein et al. (2013, 2016), Bauswein & Stergioulas (2017), Hotokezaka et al. (2013), Feo et al. (2017), and Maione et al. (2017) have been used.
Copyright and Terms & Conditions
© 2018. The American Astronomical Society. All rights reserved.
Copyright ©
2026 Astronomy Image Explorer. All Rights Reserved.