Image Details
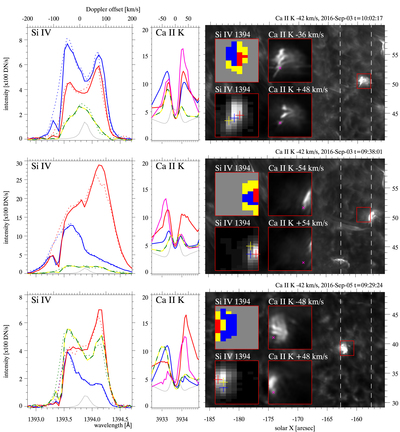
Caption: Figure 3.
UV burst spectral profiles and diagnostics. The left two panels show spectral profiles at three different spatial locations marked with three different colors: blue, red, and green/yellow, all recorded during the same IRIS raster time. The three different spatial locations are in close proximity of each other; their locations are marked with crosses in the inset Si IV raster maps in the right panels. The solid lines in the left panels are for Si IV 1394 Å and the dotted lines are Si IV 1403 Å profiles, shifted in wavelength and multiplied by a factor of 2 to compensate for the difference in the atomic transition’s oscillator strength. The right panels show Ca II K profiles in arbitrary units and averaged over the IRIS pixel. The pink profile is from a CHROMIS pixel in a plasmoid marked with a pink cross in the Ca II K insets in the right panels. The thin gray profiles are average spectral profiles for reference, the average Si IV 1394 Å profile is multiplied by a factor 10 for clarity. The wide right panel is a Ca II K wing reference image, the vertical dashed lines mark the IRIS raster extent. The red box outlines the region for which inset images are shown at higher magnification. The lower left Si IV 1394 Å map is integrated intensity over the full spectral window, in the top left map colors mark Si IV profile classification: red/blue pixels have strong (﹩\gt 30﹩ km s−1) redshifted/blueshifted components, and yellow have broad or triangular non-Gaussian profiles.
Other Images in This Article

Copyright and Terms & Conditions
© 2017. The American Astronomical Society. All rights reserved.