Image Details
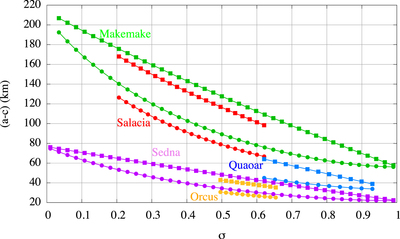
Caption: Figure 4.
Solutions of the five selected TNOs (see Table 1) for (a − c) as a function of the mass silicate ratio σ. The line with circles represents the heterogeneous solutions computed from Clairaut’s equations and the line with squares are plotted for the MacLaurin solutions. The two sets of solutions are close at σ = 0 and 1 as expected (see Figure 1(a) for an estimation of the differences). The figure shows that the difference between the homogenous and stratified solutions can be larger than the observation uncertainties, at least for Makemake and Salacia.
Other Images in This Article
Copyright and Terms & Conditions
© 2017. The American Astronomical Society. All rights reserved.
Copyright ©
2025 Astronomy Image Explorer. All Rights Reserved.