Image Details
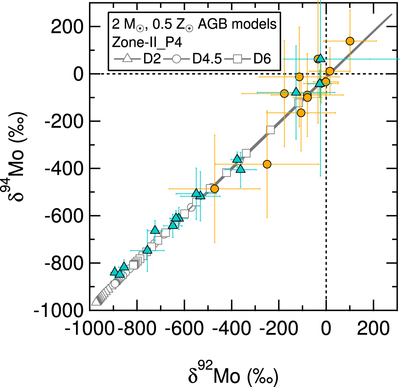
Caption: Figure 2.
A Mo three-isotope plot of δ94Mo vs. δ92Mo for SiC AB2 and MS grains from this study and Torino AGB model predictions (Gallino et al. 1998). The entire evolution of the AGB envelope composition is shown, but symbols are plotted only for third dredge-up episodes that have raised the C/O ratio above 1, when SiC can condense according to thermodynamic equilibrium calculations (Lodders & Fegley 1995). The detailed model description is given in Liu et al. (2014a, 2015), and the D2 to D6 cases in the Zone-II_P4 model for a 2 M⊙, 0.5 Z⊙ AGB star are chosen for comparison, because they best match the correlated Sr-Ba MS grain data of Liu et al. (2015). Briefly, the Zone-II_P4 model adopts a flat 13C profile in the so-called 13C-pocket with four times higher mass relative to the standard one and the D2 to D6 cases correspond to a range of 13C concentrations within the pocket. Note that the model considers the effect of Galactic chemical evolution and as a result, the predictions start from positive values instead of the solar composition.
Other Images in This Article
Copyright and Terms & Conditions
© 2017. The American Astronomical Society. All rights reserved.