Image Details
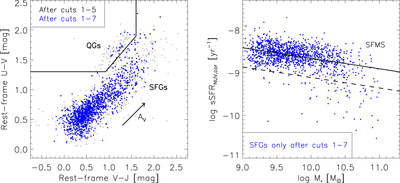
Caption: Figure 1.
Left panel: rest-frame global UVJ diagram for the parent samples after applying selection cuts 1–5 and 1–7 (see Section 1), respectively. The solid lines indicate the classification criterion provided by Williams et al. (2009). The arrow shows the Calzetti vector. Right panel: sSFR vs. stellar mass for only UVJ-defined SFGs after cuts 1–7. The solid line shows the best-fit linear relation to the SFMS. The transition galaxies, defined as having residuals ﹩{\rm{\Delta }}\,\mathrm{log}\,{\mathrm{sSFR}}_{\mathrm{NUV},\mathrm{cor}}\lt -0.45\,\mathrm{dex}﹩ (below the dashed line), are excluded in this analysis.
Other Images in This Article
Copyright and Terms & Conditions
© 2017. The American Astronomical Society. All rights reserved.
Copyright ©
2026 Astronomy Image Explorer. All Rights Reserved.