Image Details
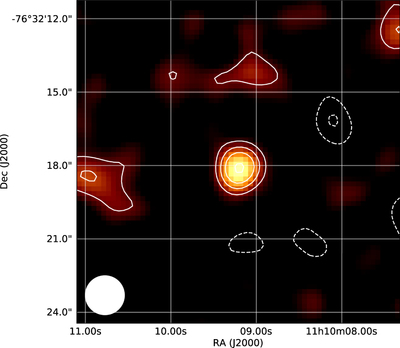
Caption: Figure 1.
Frequency collapsed ALMA Band 6 data of OTS44. The 1.″6 × 1.″6 beam is displayed in the lower left corner. Solid-line white contours highlight regions with 3, 5, 7, and 10 times the rms of the data (9.8 μJy/beam). Dashed-line white contours highlight ﹩-3\times ﹩ rms and ﹩-5\times ﹩ rms regions, and there are no data at the −7 and −10 rms levels.
Other Images in This Article
Copyright and Terms & Conditions
© 2017. The American Astronomical Society. All rights reserved.
Copyright ©
2026 Astronomy Image Explorer. All Rights Reserved.