Image Details
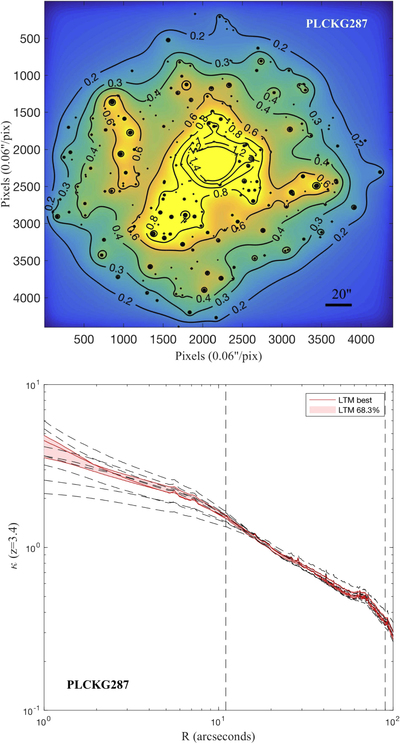
Caption: Figure 2.
Top: map of κ, the projected surface mass density in units of the critical density for lensing, scaled to the redshift of system 7, ﹩{z}_{s}\simeq 3.4﹩. Bottom: the corresponding radially averaged mass density profile. The profile slope in the range [1, 84] arcseconds (∼440 kpc, about twice the Einstein radius) is ﹩d\mathrm{log}\kappa /d\mathrm{log}\theta \simeq -0.55﹩, similar to other well-known lensing clusters (Figure 7 in Zitrin et al. 2015). Vertical dashed lines mark the area in which there are multiple-image constraints. The black, dashed profile lines demonstrate the range spanned by models run with different choices of fixed source redshifts.
Other Images in This Article
Copyright and Terms & Conditions
© 2017. The American Astronomical Society. All rights reserved.