Image Details
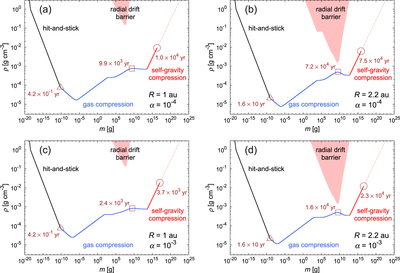
Caption: Figure 1.
Pathways of rocky planetesimal formation in the minimum mass solar nebula. The black lines show the evolutional tracks through dust growth via hit-and-stick without compression. The blue and red lines represent dust aggregation with gas compression and self-gravity compression. The solid lines (black, blue, and red) show that dust aggregates evolve with orderly growth, and dashed lines (red) represent the runaway growth. The triangles, squares, and circles mark the sizes for which ρhit = ρgas, ΩK ts = 1, and ﹩{\rm{\Delta }}v=\sqrt{{Gm}/r}﹩, respectively. The pink shaded regions indicate where the timescale of radial drift is less than the timescale of growth. (a) For R = 1 au and α = 10−4. (b) For R = 2.2 au and α = 10−4. (c) For R = 1 au and α = 10−3. (d) For R = 2.2 au and α = 10−3.
Copyright and Terms & Conditions
© 2016. The American Astronomical Society. All rights reserved.