Image Details
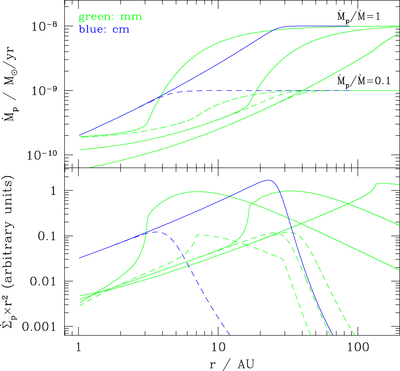
Caption: Figure 2.
Radial projection of the models shown in Figure 1. Upper panel: the radial dependence of the particle mass accretion rate. Lower panel: the radial dependence of planetesimal formation. Solid curves refer to models with ﹩{\dot{M}}_{p}/\dot{M}=1﹩, and dashed curves refer to models with ﹩{\dot{M}}_{p}/\dot{M}=0.1﹩. The assumed planetesimal formation time for the millimeter-sized particles cases increases from right to left (﹩K={10}^{2},{10}^{3},{10}^{4}﹩). For centimeter-sized particles only the case with ﹩K={10}^{2}﹩ is plotted.
Other Images in This Article
Copyright and Terms & Conditions
© 2016. The American Astronomical Society. All rights reserved.
Copyright ©
2025 Astronomy Image Explorer. All Rights Reserved.