Image Details
Caption: Figure 1.
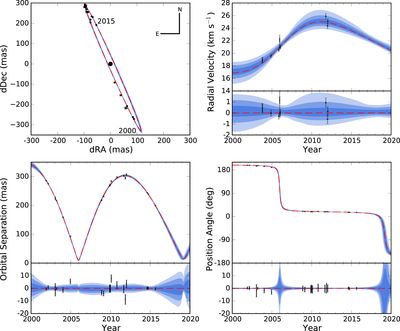
(top left) Astrometry for GJ 3305 AB. Data points correspond to the observations listed in Table 1. Blue lines correspond to random draws from the posterior distributions of orbital elements. The red, dashed line corresponds to the maximum likelihood orbit. (top right) RV data for GJ 3305 A from the literature. The published uncertainties are in black; in gray are the best-fitting uncertainties, incorporating an RV jitter model. The red, dashed line corresponds to the maximum likelihood orbit. The blue shaded regions correspond to the 1-, 2-, and 3-σ uncertainties in the RV of GJ 3305 A. (bottom left) Measured separations for GJ 3305 AB and residuals from the maximum likelihood model. Each feature on the plot retains its meaning from the previous subplot. (bottom right) Measured position angles for GJ 3305 AB and residuals from the maximum likelihood model.
Other Images in This Article
Copyright and Terms & Conditions
© 2015. The American Astronomical Society. All rights reserved.