Image Details
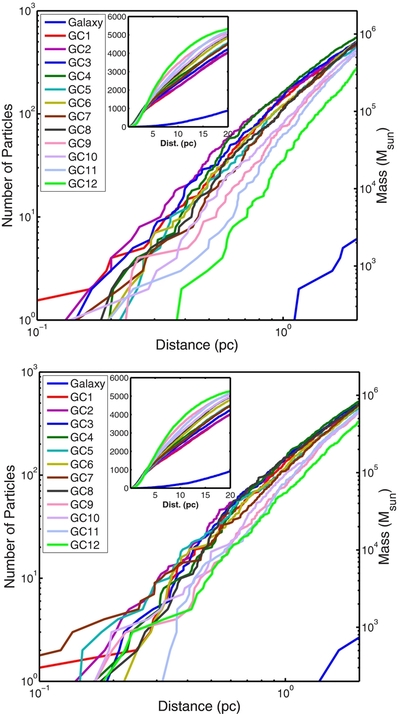
Caption: Figure 1.
Radial distribution of the infalling clusters’ stellar populations. Top: the radial distribution following the last cluster infall (after the initial relaxation). Bottom: the same at 12.4 Gyr (1.05 t r (2 pc)). As can be seen in both cases, the clusters populations show clear differences with the earlier infalling clusters showing systematically more compact configuration in the central region (<2 pc) and then an opposite behavior outside. Insets show the large scale (20 pc) distribution; note the linear scales in insets.
Other Images in This Article
Copyright and Terms & Conditions
© 2014. The American Astronomical Society. All rights reserved.
Copyright ©
2025 Astronomy Image Explorer. All Rights Reserved.