Image Details
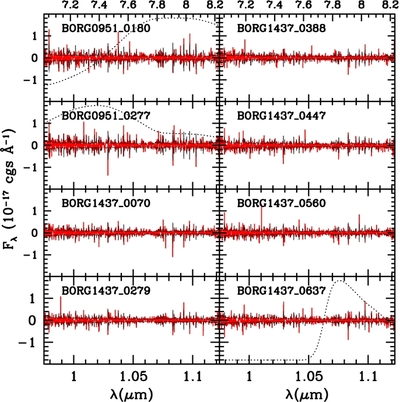
Caption: Figure 1.
Mosaic of the reduced MOSFIRE spectra for targets with only Y-band spectroscopic data. The red histogram shows the actual spectrum, while the black envelope shows the 1σ noise level. All spectra are consistent with pure noise. The top label shows the redshift coverage of the spectra for Lyα redshift. For all objects in the statistical sample (see the discussion in the text), the photometric redshift posterior distribution function is shown as the black dashed curve.
Other Images in This Article
Copyright and Terms & Conditions
© 2013. The American Astronomical Society. All rights reserved.
Copyright ©
2025 Astronomy Image Explorer. All Rights Reserved.