Image Details
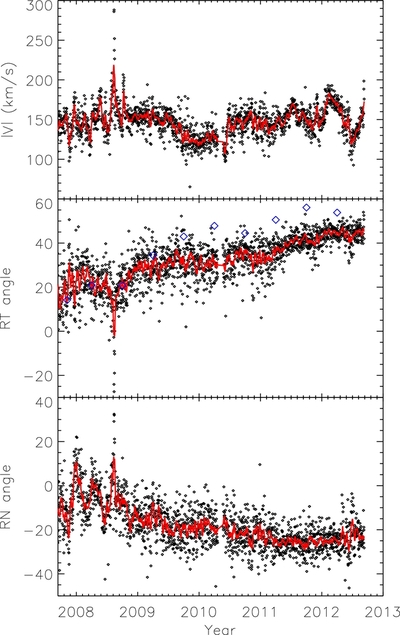
Caption: Figure 2.
Daily (points) and 11 day running averages (lines) of the speed, RT angle, and RN angle observed at V2. The diamonds on the RT plot show the angles corrected for the instrument response.
Other Images in This Article
Copyright and Terms & Conditions
© 2012. The American Astronomical Society. All rights reserved.
Copyright ©
2025 Astronomy Image Explorer. All Rights Reserved.