Image Details
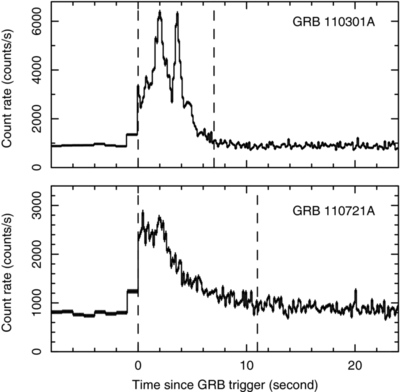
Caption: Figure 1.
Light curves of the prompt gamma-ray emission of GRB 110301A (top) and GRB 110721A (bottom) detected by GAP. The vertical dashed lines indicate the time interval of polarization analyses for each burst.
Other Images in This Article
Copyright and Terms & Conditions
© 2012. The American Astronomical Society. All rights reserved.
Copyright ©
2025 Astronomy Image Explorer. All Rights Reserved.