Image Details
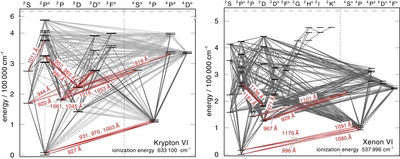
Caption: Figure 2.
Grotrian diagrams of Kr vi and Xe vi model ions. Dark and light gray graphs: radiative transitions with known and unknown f values, respectively. Red graphs with wavelengths: spectral lines in the FUSE wavelength range ( f values known).
Other Images in This Article

Copyright and Terms & Conditions
© 2012. The American Astronomical Society. All rights reserved.
Copyright ©
2025 Astronomy Image Explorer. All Rights Reserved.