Image Details
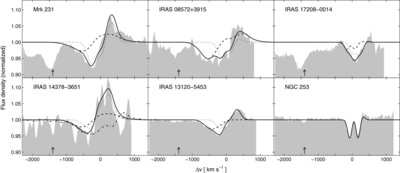
Caption: Figure 1.
Observed PACS spectra (continuum-normalized) of the OH transition at 79 μm (gray). Overplotted are the low-velocity (dotted) and high-velocity (dashed) fit components and the total fit (solid). The arrow indicates the rest position of H 2O 4 23–3 12. The dash-dotted line for IRAS 14378 shows the observed spectrum of the OH transition at 119 μm for this object.
Other Images in This Article
Copyright and Terms & Conditions
© 2011. The American Astronomical Society. All rights reserved.
Copyright ©
2025 Astronomy Image Explorer. All Rights Reserved.