Image Details
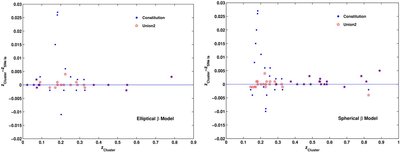
Caption: Figure 1.
Redshift subtraction for the cluster–SN Ia samples. The left panel shows the results from the De Filippis et al. (2005) sample, while the right panel from the Bonamente et al. (2006) sample. The blue points and red pentagrams represent the Constitution and Union2 data, respectively.
Other Images in This Article
Copyright and Terms & Conditions
© 2011. The American Astronomical Society. All rights reserved.
Copyright ©
2026 Astronomy Image Explorer. All Rights Reserved.