Image Details
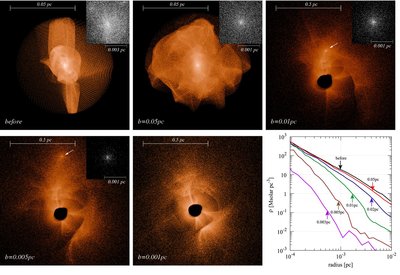
Caption: Figure 4.
Snapshots and radial density profiles after encounters with stars. Panel (a) (top left) shows the snapshot of a halo in model A at z = 31. Only particles within the radius of 0.037 pc from the center of the halo are shown. Panels (b) (top middle), (c) (top right), (d) (bottom left), and (e) (bottom middle) show the distribution of particles at 27 Myr after the encounter with a solar-mass star with the impact parameters 5 × 10 −2 pc, 1 × 10 −2 pc, 5 × 10 −3 pc, and 1 × 10 −3 pc. The black regions in the center are caused by the initial outer cutoff of the particle distribution and are not real. The upper right box in each panel shows the central region of the microhalo. The central regions are located at the center (Panels (a) and (b)), and the positions indicated by arrows (Panels (c) and (d)). In panel (e), the central region is destroyed completely. Panel (f) (bottom right) shows the density profiles after the encounter.
Other Images in This Article


Copyright and Terms & Conditions
© 2010. The American Astronomical Society. All rights reserved.