Image Details
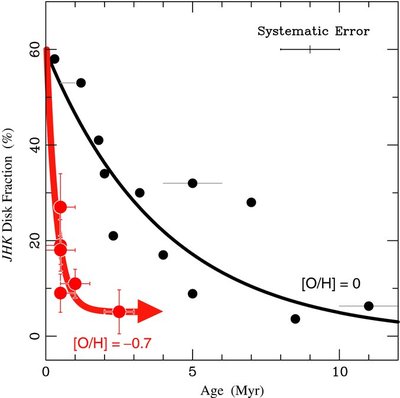
Caption: Figure 1.
Disk fraction as a function of cluster age. JHK disk fractions of the young clusters with low metallicity are shown by red filled circles, while those of young clusters with solar metallicity are shown by black filled circles. The typical systematic error of ages for the solar metallicity cluster is shown at the top-right corner (see the main text for explanation of the gray horizontal lines for three of the clusters). The black line shows the disk fraction evolution under solar metallicity, while the red arrow shows the proposed JHK disk fraction evolution in low-metallicity environments. Note that these lines are drawn by eye and are not derived with rigorous fitting.
Copyright and Terms & Conditions
© 2010. The American Astronomical Society. All rights reserved.