Image Details
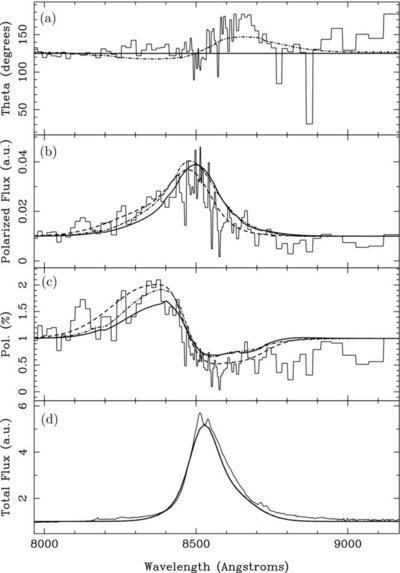
Caption: Figure 4.
Comparison of simulated and observed polarization spectra for the Hα region. The panels are the same as in Figure 1, with the exception that the total and polarized flux densities are given in arbitrary units (a.u.), while the degree of polarization is normalized to 1%. Models for viewing angles ranging from α = 170° (solid heavy line) to α = 110 (dashed line) are consistent with the data. The large change in polarization position angle coincident with the weakly polarized red wing of the Hα profile can be explained by including a second source of polarization. The effect of including a compact equatorial scattering region is shown for the α = 170° model (dot-dashed line).
Other Images in This Article
Copyright and Terms & Conditions
© 2010. The American Astronomical Society. All rights reserved.