Image Details
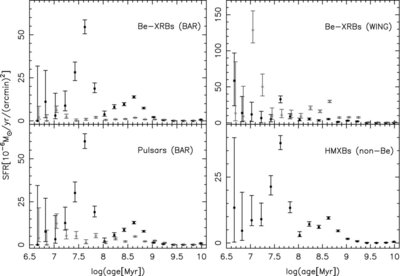
Caption: Figure 1.
Average SFH (using data from [HZ04]) of regions with and without XRBs (black and gray points, respectively) in different locations of the SMC. Top: Be–XRBs in the Bar (left) and the Wing (right). Bottom: pulsars in the Bar (left) and HMXBs over the SMC (excluding spectroscopically confirmed Be–XRBs) from Liu et al. (2005; right). For clarity, a small offset of log(age[Myr]) ~ 0.025 has been applied to the distributions of areas without Be–XRBs and/or pulsars.
Other Images in This Article
Copyright and Terms & Conditions
© 2010. The American Astronomical Society. All rights reserved.
Copyright ©
2025 Astronomy Image Explorer. All Rights Reserved.