Image Details
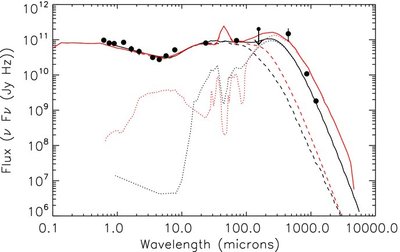
Caption: Figure 2.
SED Fits for the IR-to-submillimeter fluxes of SDSS 160705+533558 We show the results for two different fits to the SED of SDSS 160705+533558, one using the methods of Farrah et al. (2003), the other those of Hatziminaoglou et al. (2008). The Farrah fits are shown in black; the Hatziminaoglou fits are shown in red. For both fits, we show the total SED as a solid line, the starburst component as a dotted line, and the AGN as a dashed line. The photometric data are shown as points, including the upper limit at 160 μm. There are significant differences between the fits and neither is a perfect match to the data, but these two independent methods reach the same conclusion that the mid-IR emission of this object is AGN dominated, while the far-IR/submillimeter emission, which we have resolved, is dominated by a starburst.
Other Images in This Article
Copyright and Terms & Conditions
© 2009. The American Astronomical Society. All rights reserved.