Image Details
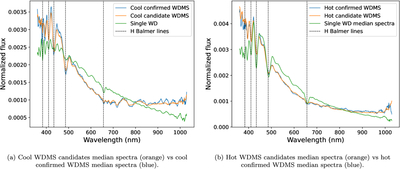
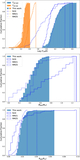
Caption: Figure 6.
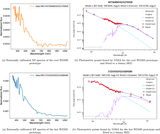
Comparison between the normalized median spectra of the confirmed WDMS (blue) and that of the candidates (orange) for both the cool and hot WDMS neurons. The median spectra of a single WD neuron with comparable GBP − GRP color is included (green) so that the red flux excess can be seen.
Other Images in This Article
Copyright and Terms & Conditions
© 2025. The Author(s). Published by the American Astronomical Society.
Copyright ©
2025 Astronomy Image Explorer. All Rights Reserved.