Image Details
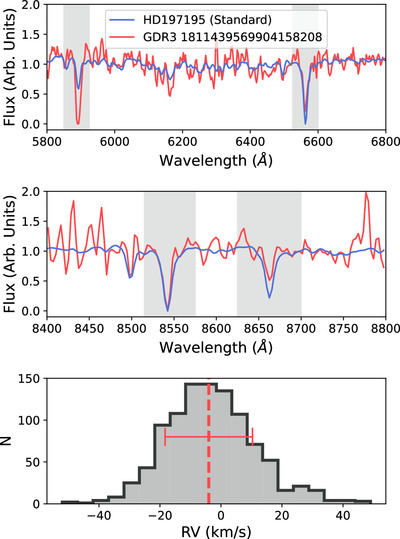
Caption: Figure 3.
The spectrum and corresponding line-of-sight velocity measurement of Gaia DR3 1811439569904158208. R ∼ 1200 spectra are shown for a standard Gaia star with a well-known radial velocity, and Gaia DR3 1811439569904158208. The absorption lines that were used to compute line-of-sight velocity are highlighted in gray. The distribution of line-of-sight velocity measurements (after subtracting the velocity of the standard star) from 1000 bootstraps is provided in the bottom panel; it has a median and standard deviation of RV = −4 ± 14 km s−1.
Other Images in This Article
Copyright and Terms & Conditions
© 2025. The Author(s). Published by the American Astronomical Society.
Copyright ©
2025 Astronomy Image Explorer. All Rights Reserved.