Image Details
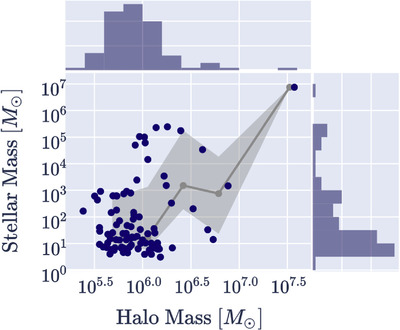
Caption: Figure 2.
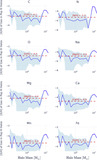
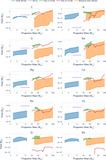
The individual stellar masses and halo masses of every star-forming halo in the simulation at redshift z = 14.5 are shown in navy. The mean stellar mass–halo mass relation for these galaxies with 16th–84th percentile scatter is shown in gray.
Other Images in This Article

Show More
Copyright and Terms & Conditions
© 2025. The Author(s). Published by the American Astronomical Society.
Copyright ©
2025 Astronomy Image Explorer. All Rights Reserved.