Image Details
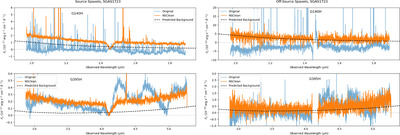
Caption: Figure 6.
Extracted 1D spectra are shown in the left two panels, using a custom aperture where included spaxels have SNR > 3 in the bright [O III] λ5008 emission line. The upper left panel shows the on-source spectrum from the G140H grating, while the lower left panel shows the on-source spectrum from the G395H grating. The right hand panels show the off-source spectra for each grating, created using the inverse of the source aperture. In each panel, blue lines show the extracted spectra before applying any 1/f noise correction, while orange lines show spectra after applying NSClean. Black dashed lines show the expected background calculated from the JWST Backgrounds Tool. The original spectra show both fluctuations and overall offsets in the continuum level caused by the 1/f noise in the detectors, while these noise features are removed by NSClean.
Other Images in This Article
Copyright and Terms & Conditions
© 2024. The Author(s). Published by the American Astronomical Society.