

Image Details
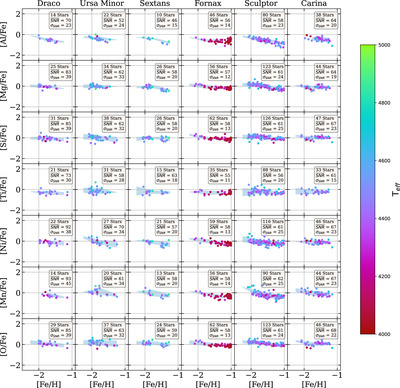
Caption: Figure 1.
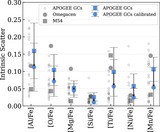
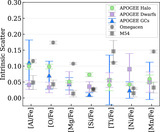
Measurements of element abundances relative to Fe for stars in our sample with S/N ≥ 25. Points are colored by T eff. The blue shaded region represents 1σ around the mean in three equally spaced bins in [Fe/H] from −2.1 to −1.
Other Images in This Article
Copyright and Terms & Conditions
© 2024. The Author(s). Published by the American Astronomical Society.

Copyright ©
2026 Astronomy Image Explorer. All Rights Reserved.
