Image Details
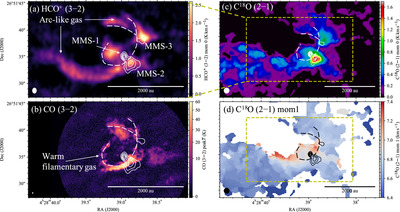
Caption: Figure 2.
(a) Color scale image showing the HCO+ (3–2) moment 0 map with a velocity range of 6.7–7.1 km s−1. The white contours show the 1.3 mm continuum image with a contour step of 0.36 mJy beam−1 (reproduced data from Tokuda et al. 2014). The contours in the other panels are the same as those in panel (a). Ellipses give the angular resolution of each panel’s image in the lower left corners. (b) Color scale image showing the peak brightness temperature map of CO (3–2) with a velocity range of 0.2–6.2 km s−1 (reproduced data from Tokuda et al. 2018). The white dotted lines highlight the warm filamentary gas components. The same lines are also illustrated in the other panels. (c) Color scale image showing the C18O (2–1) moment 0 map with a velocity range of 6.4–7.5 km s−1 (reproduced data from Tokuda et al. 2018). (d) Color scale showing the C18O (2–1) moment 1 map.
Other Images in This Article

Copyright and Terms & Conditions
© 2024. The Author(s). Published by the American Astronomical Society.