Image Details
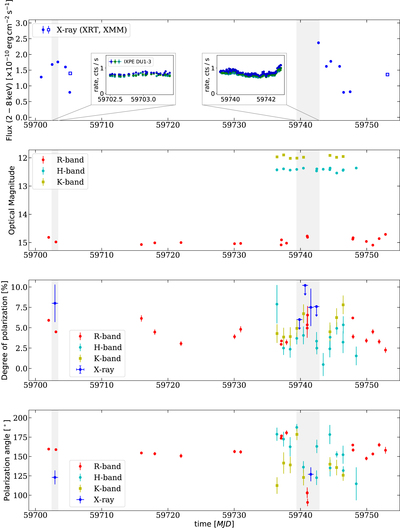
Caption: Figure 2.
X-ray, optical, and IR light curves contemporaneous with the IXPE observations of 1ES 1959+650. Observations are described in Sections 2 and 3. Panels show, from top to bottom, X-ray flux, optical and IR brightness in magnitudes, degree of polarization, and polarization angle. Inset plots in the top panel display the X-ray light curve measured by IXPE. Blue data points represent significant measurements of X-ray polarization, while blue downward-pointing arrows indicate 99% confidence level upper limits during time periods without a significant detection of X-ray polarization. Gray vertical shaded areas indicate the two epochs of observation of IXPE.
Other Images in This Article
Copyright and Terms & Conditions
© 2024. The Author(s). Published by the American Astronomical Society.